The Resilience Report Nobody Reads (and What to Send Instead)
A 200-page report and a 20-tab workbook prove effort, not readiness. What leaders need instead, and five tests for any resilience dashboard.
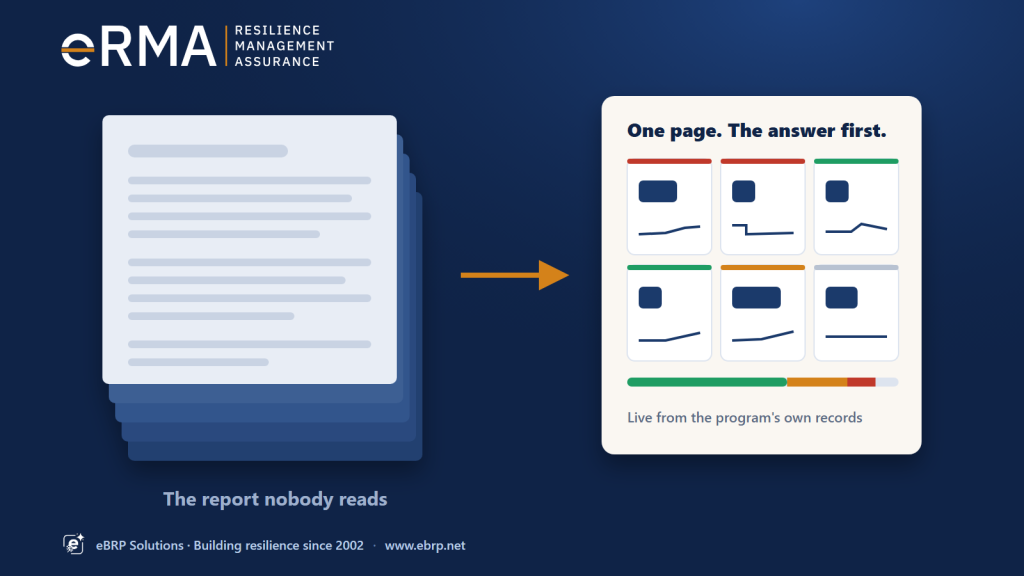
Every resilience program produces it. A report of two hundred pages, a workbook of twenty tabs and two thousand rows, assembled over two weeks and sent to the people who are meant to govern the program. It shows that a great deal of work was done. What it rarely shows is whether the organization could keep delivering if something went wrong tomorrow, and it almost never gets read.
That isn’t a failing of executives. It is a failing of the format.
Why the big report fails
It answers the wrong question. A long report is organized the way the program is organized: BIA, then risk, then plans, then exercises, each with its own appendix. A leader’s question cuts across all of them: “Can we keep delivering our important services, and if not, what is in the way?” The answer is spread over a hundred pages, so nobody assembles it.
It is out of date on arrival. Two weeks of collation means the numbers describe the program as it was, not as it is. By the time a question comes back, the analyst has to re-run the spreadsheet to answer it.
No two versions agree. Each line of business keeps its own workbook, with its own definitions. Totals from different reports don’t reconcile, and a meeting that should be about decisions turns into a meeting about whose numbers are right.
Green hides gaps. A status column turns green when a document exists and its review date is current. Missing data shows as blank, and blank reads as fine. A program can look healthy on paper while its recovery objectives have never been tested.
What leaders actually need
Executives and program stakeholders need far less, presented far better:
- One answer per question. Can we deliver within tolerance? Where is risk concentrated? Is the BIA cycle on track? Each question gets its own page, with the answer first.
- The exceptions, by name. The service whose recovery has never been proven, the single supplier three lines of business depend on, the plan overdue for review.
- Their own part of the organization. The board sees the enterprise; a business head sees their division; a department head sees their department, with the same measures at every level.
- Movement over time. Better or worse than last quarter, and since when.
- A way to check. Any number can be followed back to the records behind it, by whoever is entitled to see them.
Five tests for a resilience dashboard
Many tools now offer a “dashboard”. Before trusting one with a board, put it through five tests.
- Is it live? Does it read the records the program maintains, or a copy exported last month? If someone has to refresh it by hand, it is the old report with better colours.
- Does unknown look like unknown? A service with no evidence of recovery should show as unproven, not green. Ask to see a record with missing data and check how it is counted.
- Do the totals agree for everyone? If a department head and the CEO see different totals because of their access, the dashboard creates the same reconciliation argument as the spreadsheets. Totals should count everything; only detail should be restricted.
- Does it follow the organization? One dashboard should serve every level by changing scope, not by building a separate report for each division. A restructure shouldn’t break it.
- Can it leave the room safely? Boards still want paper. A printed page should state what it shows, who produced it, when, for which part of the organization, the date the data is as of, and how it may be shared. Without that, a printout becomes an uncontrolled copy the moment it’s made.
The board pack doesn’t disappear. It gets thinner.
Governance still needs a record: minutes refer to what the board saw, auditors ask for it later, and regulators expect evidence that leadership was informed. The difference is that the pack becomes a dated snapshot of live dashboards, built in minutes instead of weeks, rather than a document assembled by hand. The detail is still there for anyone who needs it, one click behind the summary rather than a hundred pages behind it.
Where eRMA fits
eRMA, the resilience platform from eBRP Solutions, includes Executive Dashboards that pass all five tests:
- The answer comes first: six headline numbers, each with its trend.
- One page for every level: the org chart, coloured by risk; click a unit to look inside.
- Every number opens: the records behind it, with the same totals for everyone. Unknown is never shown as healthy.
- Ready for the board: print a dated, marked board pack, or share a live link.
See the Executive Dashboards feature →
Three questions for your next board report
- Which page would a director need to read to know whether the important services can be delivered within tolerance?
- How old are the numbers on that page on the day the board reads it?
- If a director asks “which service, and why?”, how long does the answer take?
If the honest answers are “page 140”, “a month” and “we’ll come back to you”, the program isn’t short of data. It’s short of a page that gets read.
Join an eRMA showcase: sixty minutes, live on Microsoft Teams. · Download the eRMA brochure: see the possibilities.