Executive Dashboards: resilience on one page, not two hundred
The questions leaders ask about resilience, answered on one page from the program's own records. Nothing to reconcile.
Leaders ask the same few questions about resilience. How exposed is the organization? Where is it weakest? Can recovery be proven? eRMA’s Executive Dashboards answer them on one page, from the records the program keeps up to date every day. Nothing is copied into a spreadsheet, so there is nothing to reconcile.
The problem it solves
- “The board pack takes two weeks to put together, and it’s out of date the day it’s printed.”
- “Every business line reports its own numbers, and they never add up.”
- “The answer the board wants is somewhere on page 140.”
How it works
1. The answer comes first
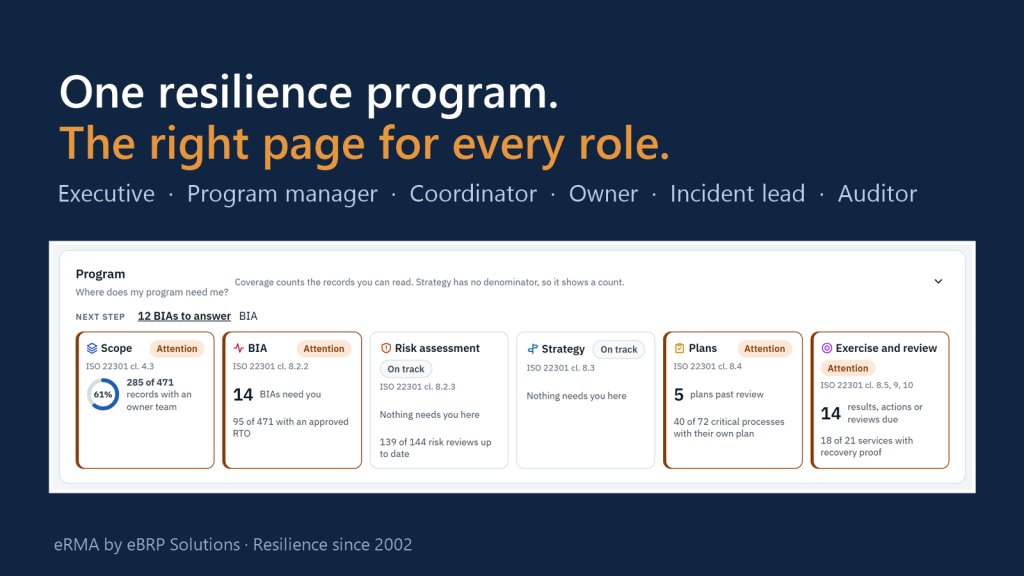
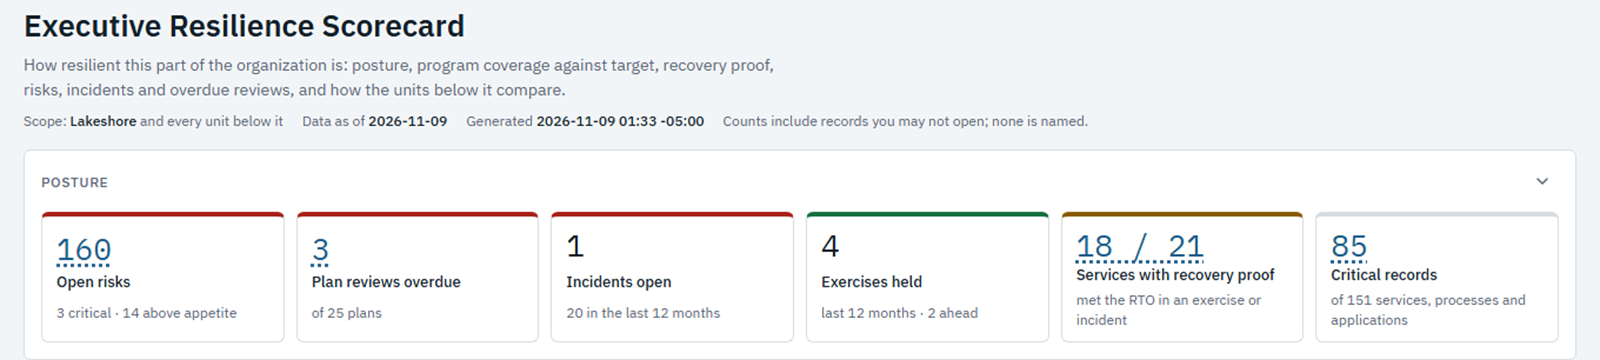
The Executive Resilience Scorecard opens on six numbers: open risks, plan reviews overdue, incidents open, exercises held, services with proven recovery, and critical records. Trend lines below them show how each has moved over the last 90 days.
2. One page for every level
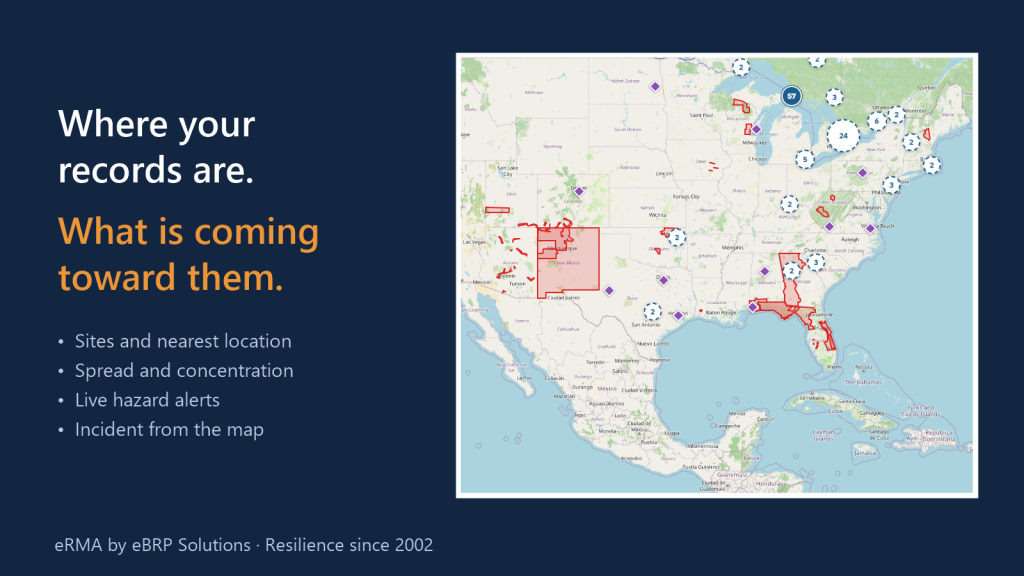
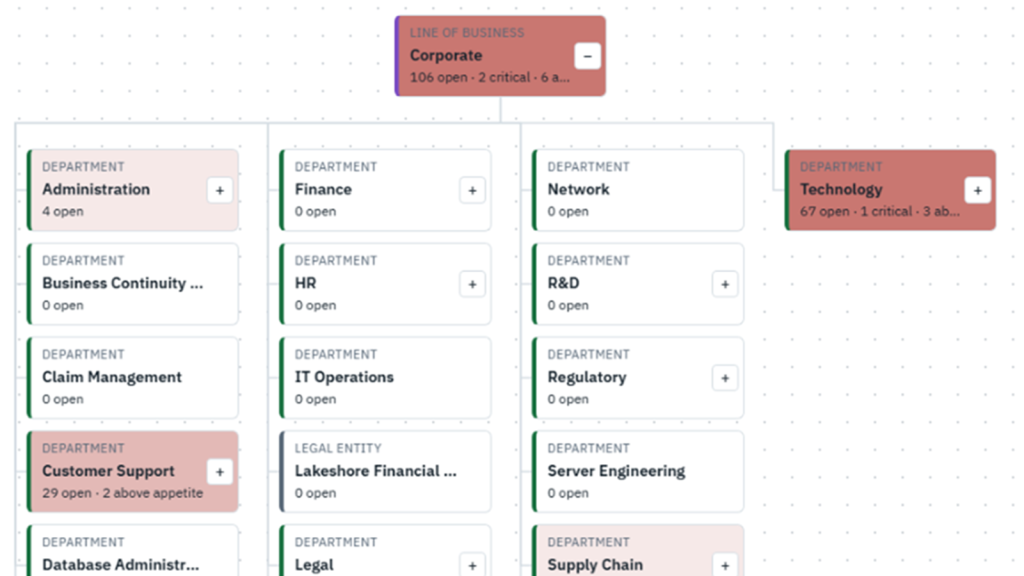
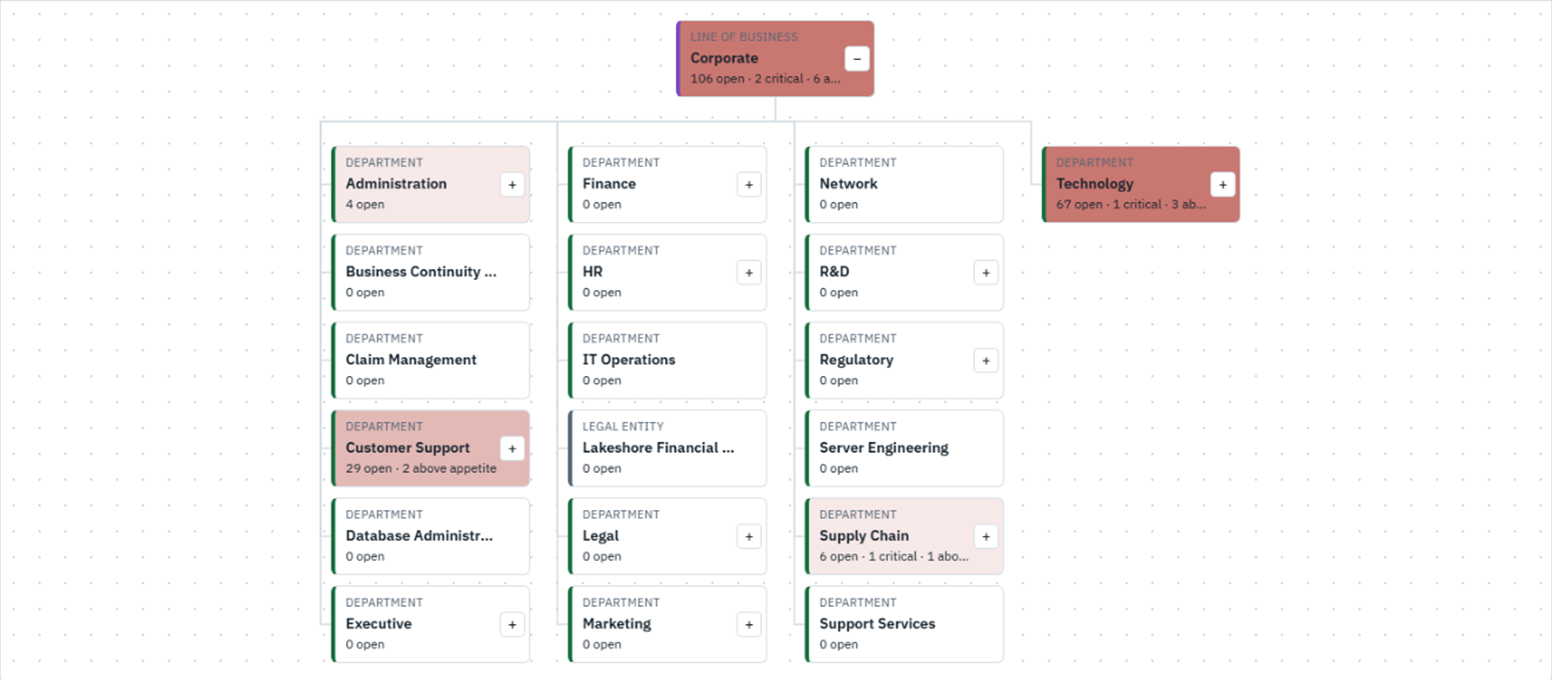
Dashboards follow the organization chart. The Resilience Map colours each unit by the measure chosen, and a click opens the unit to show what is inside. The board sees the whole organization, and each business head sees their own part, on the same page.
3. Every number opens
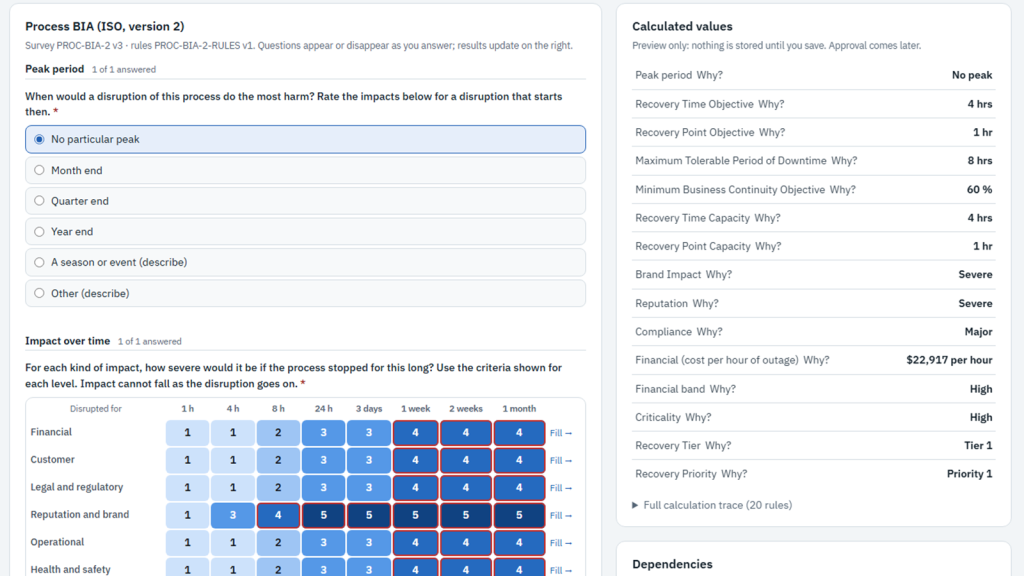
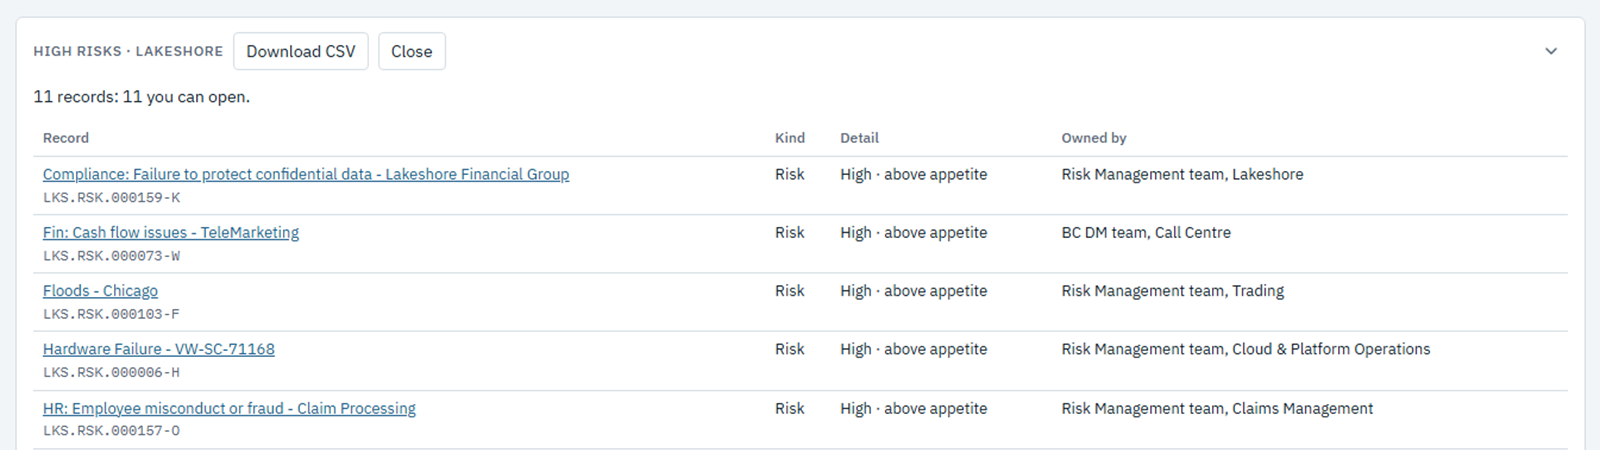
Click a number to see the records behind it. Everyone sees the same totals. Records a viewer is not allowed to open are still counted, but not shown.
Ready for the board
Print a dashboard, or combine several into one board pack PDF, dated and marked confidential. Or share a link that each reader opens with their own access.
What it proves
One set of numbers, taken from the program’s own records, for the board and the business alike. Unknown is never shown as healthy, and Restricted is never shown as zero.
See it on your own data: Book a demo