Dashboard & Reports
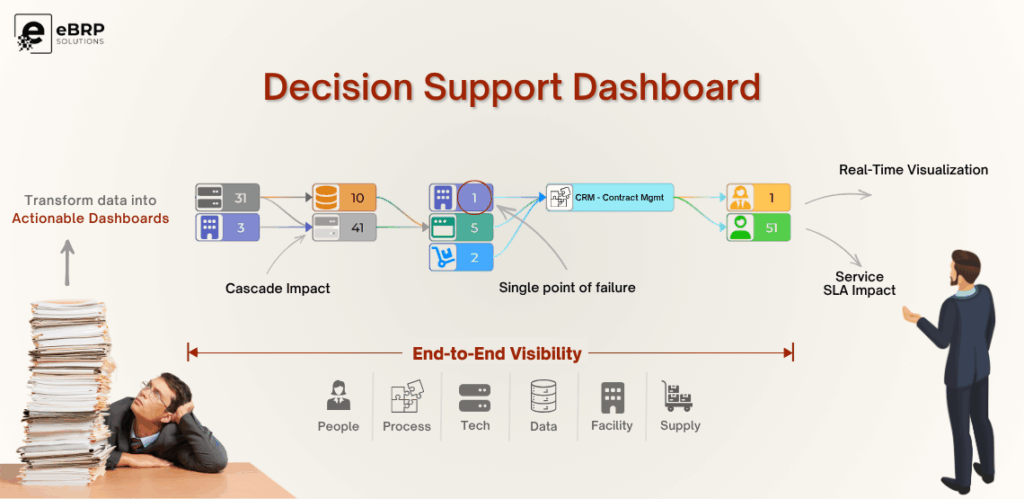
Dashboards and Reports in the eBRP Suite serve as vital enablers of visibility, measurement, and management across the Enterprise Resiliency lifecycle. Embedded across all modules—Toolkit (TK), CommandCentre (CC), and eZPlanner (eZP)—they transform complex, multi-dimensional data into actionable insights, empowering stakeholders at all levels to monitor program performance, identify gaps, and support compliance and strategic readiness.

The Dashboards & Reports framework in eBRP Suite is designed for:
Role-Based Visibility: Personalized to user roles—Executive, Planner, Risk Owner, Auditor, Responder.
Real-Time Metrics: Live data drawn from authoritative sources and system activities.
Program-Wide Coverage: From Risk Assessment to Plan Execution to Post-Incident Review.
Interactive Navigation: Drill-down capabilities to investigate metrics and trigger workflows.
Available Dashboards
Impact Dashboards
Visualize cascading upstream/downstream dependencies (Service → Process → Asset → SLA).
Identify Single Points of Failure (SPOFs) and service disruptions.
Integrated with the Process Model and GIS mapping.
Used for impact simulations and “What If?” threat scenarios.
Plan Execution Dashboards
Monitor RTO/RTC adherence during Test or Real Events.
GANTT charts track task status across Plans.
Real-time recovery status by location, team, or process.
Incident Command Dashboards (via CommandCentre)
Track status of Incidents, Tasks, Assets, and Teams.
Incident Monitor, Plan Monitor, MyToDo Task Status dashboards.
Integrated escalation, pause/resume, and decision-support controls.
Training & Exercise Dashboards
Attendance, role participation, and task execution during simulations.
Supports post-exercise review and training gap analysis.
Program Maturity Dashboards
Visualize entity reviews, approval workflow progress, update compliance.
Maturity scorecards for business units and departments.
Reporting Capabilities
Standard Reports (300+)
Prebuilt templates spanning Risk, Impact, Asset, Plan, Test, and Compliance metrics.
Exportable in PDF, Excel, and CSV formats.
Role-restricted access with audit logs.
Custom Report Builder
Drag-and-drop UI to define report parameters.
Supports filters, conditional formatting, and schedule-based delivery.
Regulatory & Audit Reports
Aligned with ISO 22301, FFIEC, NIST, and internal policy frameworks.
Evidence logs, historical test records, critical asset maps, and RTO compliance.
Review & Compliance Reports
Upcoming/overdue entity reviews.
Workflow completion timelines and bottleneck indicators.
Change & Activity Logs
Track who changed what, when, and why.
Supports internal audit and forensics.
Executives: Monitor SLA alignment, threat exposure, and recovery performance.
Planners: Detect gaps in plans, data inconsistencies, or stale RTOs.
Auditors/Regulators: Demonstrate compliance with internal and external mandates.
Crisis Managers: Track live incident progression, decision logs, and team readiness.
IT & Data Teams: Analyze dependencies, recoverability of applications/hardware.
Enhanced Situational Awareness: Real-time insights for informed decision-making.
Program Transparency: Enterprise-wide visibility across resilience components.
Informed Strategy Development: Use dashboards to refine continuity strategies.
Compliance & Audit Readiness: Structured reporting for internal and external reviews.
Efficiency through Automation: Minimize manual reporting efforts with live data feeds.
For resiliency teams seeking to Monitor, Measure, and Manage, the Dashboards & Reports feature set in eBRP Suite provides an indispensable control tower—backed by real-time data integrity, decision support, and stakeholder engagement.
eBRP Suite:
Engineered for Resilience, Powered by Innovation
AI-powered resilience, real-time incident management, and Process Modeling—delivering scalable solutions to build and manage enterprise resiliency programs to address today’s threat landscape.
