Map and situational awareness: see what an event will reach
Every record placed where it runs, spread and concentration judged for you, and live hazard alerts drawn over the sites they reach.
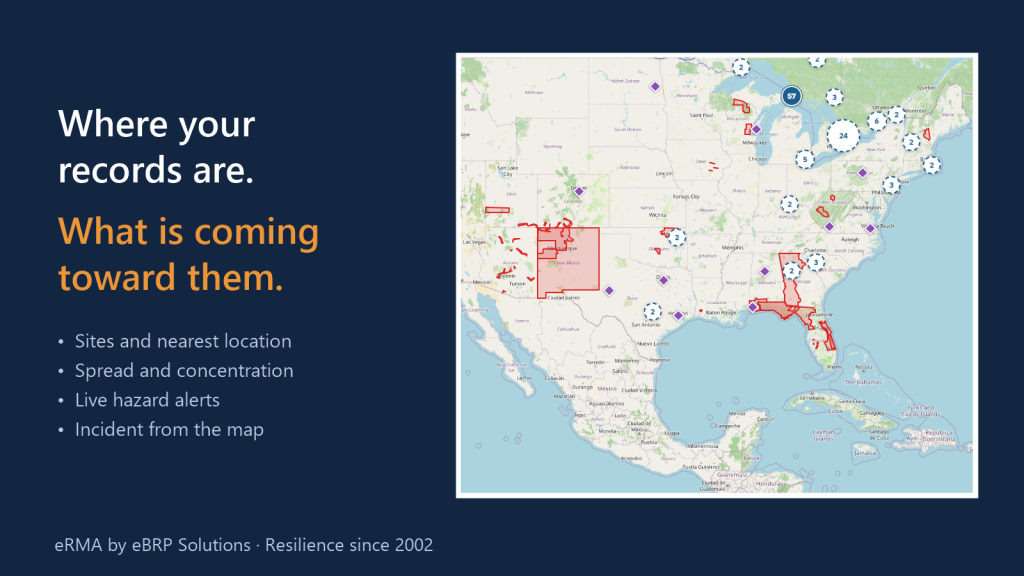
Every resilience program eventually gets the same phone call: there is a wildfire, a hurricane warning, a flood, a power cut across a region. What do we have there? Most programs answer it by searching spreadsheets for city names. eRMA answers it on a map. Every process, application, service, plan, server, employee and vendor is placed where it actually runs, so the question becomes a picture: where your records are, how exposed they are, and what is coming toward them.
The problem it solves
- “When an alert comes in, it takes hours to work out which of our sites and processes are in the area.”
- “We think we have a second site for everything, but nobody has checked how far apart the sites really are.”
- “Our critical work is concentrated in one city, and the only time anyone noticed was during an outage.”
How it works
1. Every record, placed where it runs
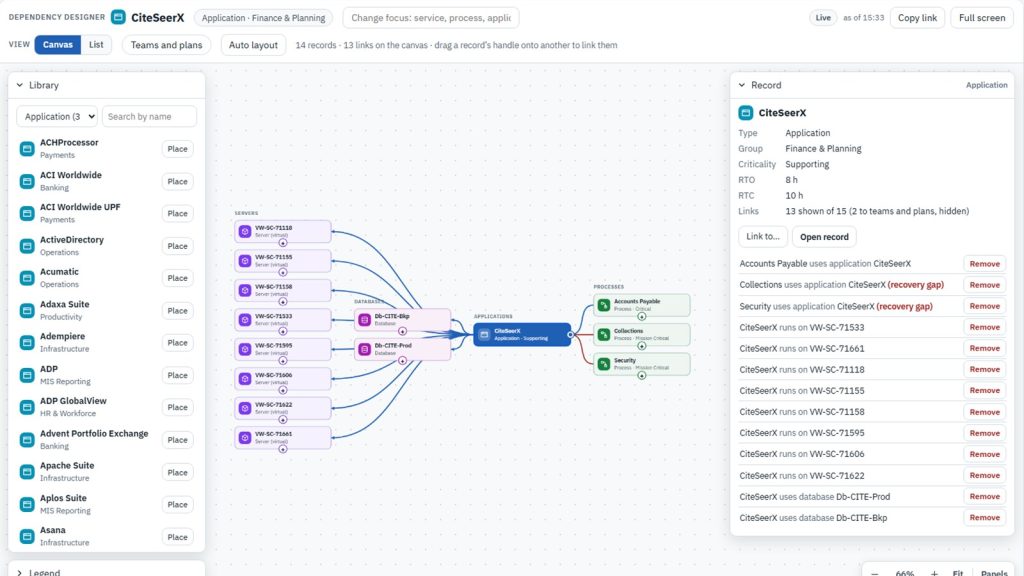
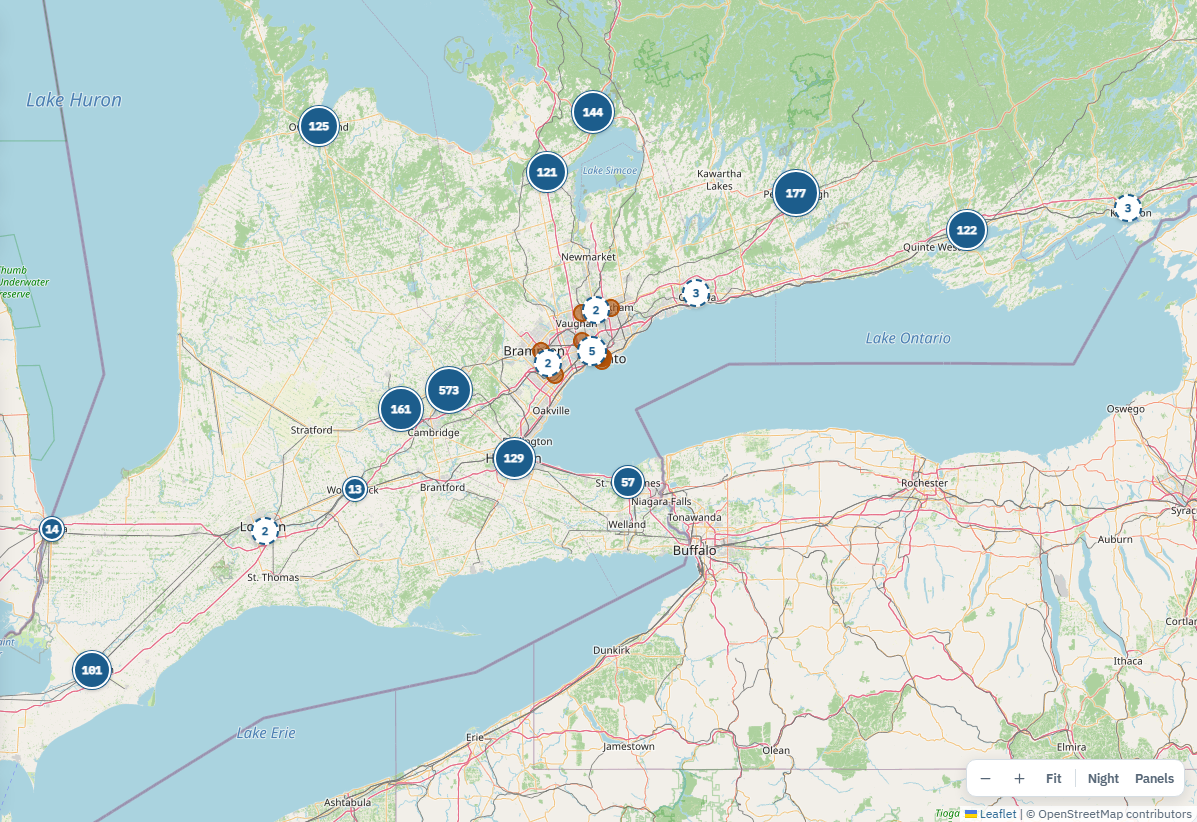
Locations, employees and vendors sit at their own addresses. Processes, applications, services, plans, databases and servers are placed at the locations their dependencies lead to, so a process shows up wherever its people work and wherever its systems run. On each record’s page, a map card under “Where it runs” shows its nearest locations first, with technology sites one click away. Locations the viewer is not allowed to open are drawn in grey and counted, never named. Records with no position are listed as not placed, not quietly left off the map.
2. Spread and concentration, judged for you
Spread looks at each process, application or service and gives it a verdict: single site, clustered, one region, spread or not placed. It can judge by work sites, where the work is done, or by technology sites, where its systems run. Sites closer together than a set distance count as one cluster, so two offices across the street are not mistaken for a recovery option.
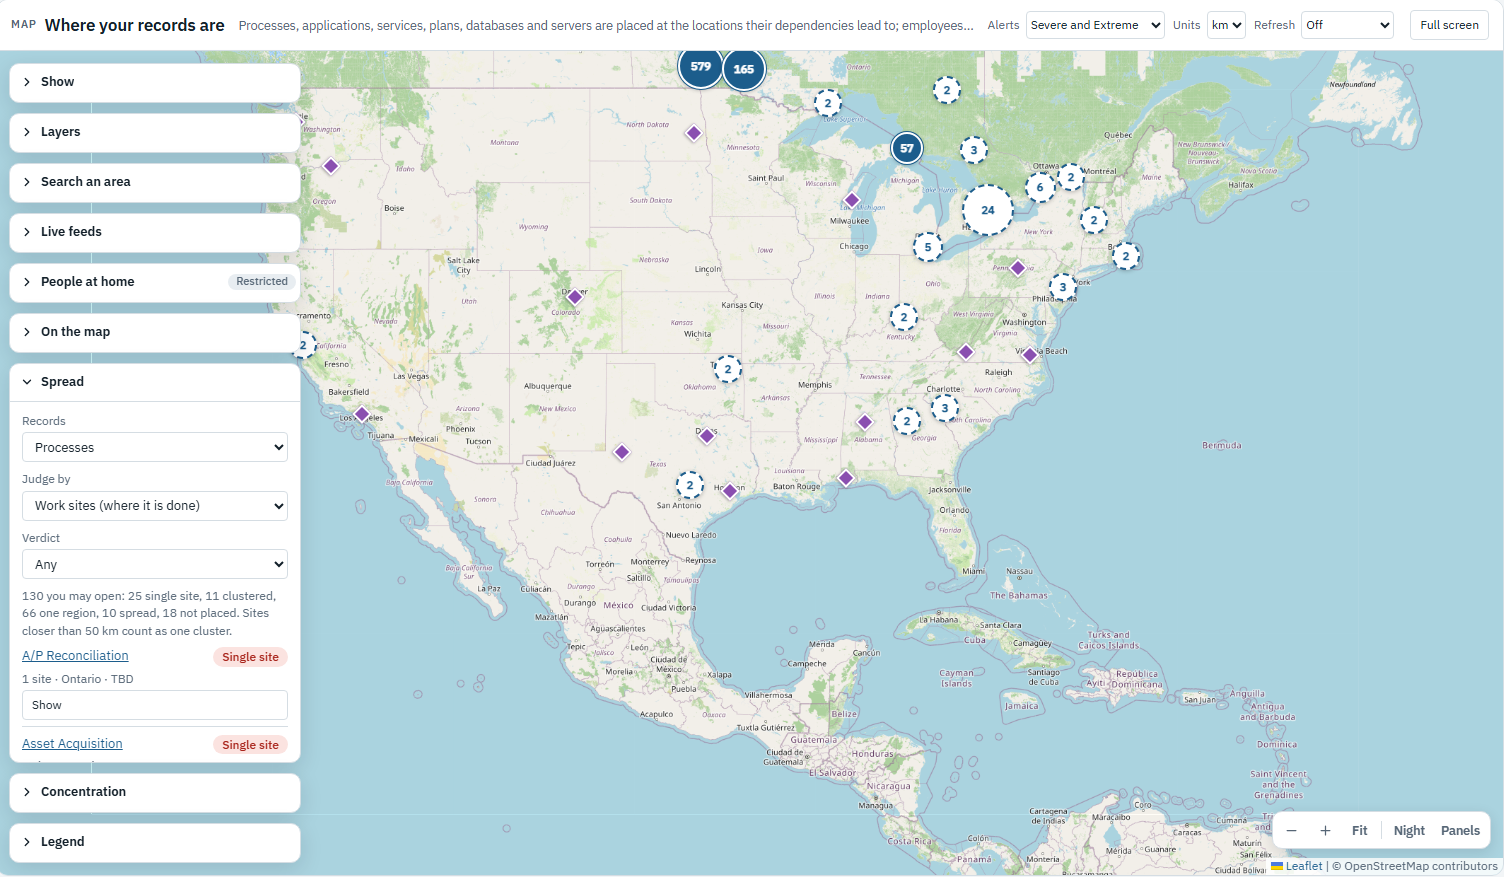
Concentration turns the question around. It groups sites that sit close together, or by state and province, and shows for each area how many critical records would be lost entirely if it went dark, how many employees work there, and how many severe alerts have reached it in the last twelve months. “Find what is lost” lists the records with no site outside the area.
3. Search any area
Draw a rectangle, circle or polygon, pick a boundary such as a country, state, province or US county, or upload a KML, KMZ or GeoJSON file. eRMA finds every record with a site in the area, or only the ones that would be lost entirely because no work site or technology site sits outside it. Areas can be saved as shared layers and reused in the next exercise.
4. Live hazard alerts over your records
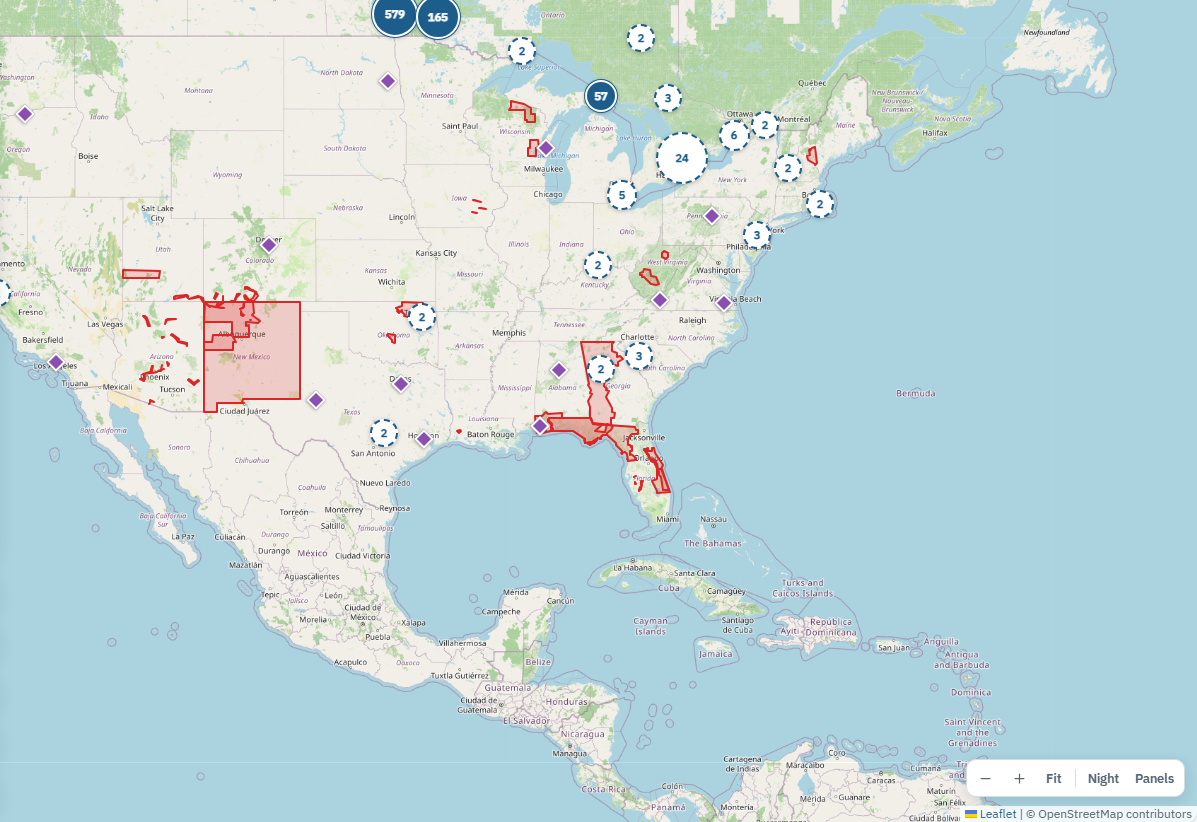
eRMA reads public alert feeds, such as US National Weather Service alerts, FEMA disaster declarations, Canada’s public alerting system, European and global warning services, and the alert feeds of national weather agencies that publish them. Severe and extreme alert zones are drawn over the records they reach. Anyone can watch a layer and be notified when an alert reaches it, and each alert that touched an area is kept as history, so the risk assessment can see what has actually happened at a site, not only what might. Feeds are switched on by each organization, after its administrator accepts each source’s terms; until then eRMA calls nothing outside.
5. From the map to the response
When an alert or event needs a response, an incident can be opened straight from the map with its area attached. eRMA assesses every record in the area, suggests a severity from the alert, and keeps a snapshot of what the area held at that moment. A one-page situation brief prints as a PDF. During the incident, its own Map tab shows the assessed records, live alerts over the footprint and the roll call. The same areas become a scenario’s footprint, so an exercise can show exactly what the event would have reached.
What holds it together
- One set of records. The map, the business impact analysis, the plans and the incident all read the same locations and dependencies. A site is recorded once.
- Restricted is never zero. Records a viewer cannot open are still counted, so a total on the map matches the total everywhere else.
- Unknown stays unknown. A record with no position shows as not placed. It never counts as safe because it is missing from the map.
- People’s homes stay private. Where staff live can be shown only as counts per square, never a home, only to teams an administrator grants, and every look is logged.
Running eRMA in an air-gapped deployment? There, eRMA never calls out. eRMA Portal Services brings live hazards, emerging threats and regulatory change across the gap as signed files, each one verified and approved before anything is applied. Get the eRMA Portal Services brochure (PDF)
See it with your own sites: Book a demo