The GIS Map in the eBRP Suite turns raw data into an interactive, visual layer bridging the gap between static spreadsheets and real-world decision-making.
Integrated across Toolkit, eZPlanner, and CommandCentre, it uses Google Maps to visualize assets, threats, and dependencies in real time.
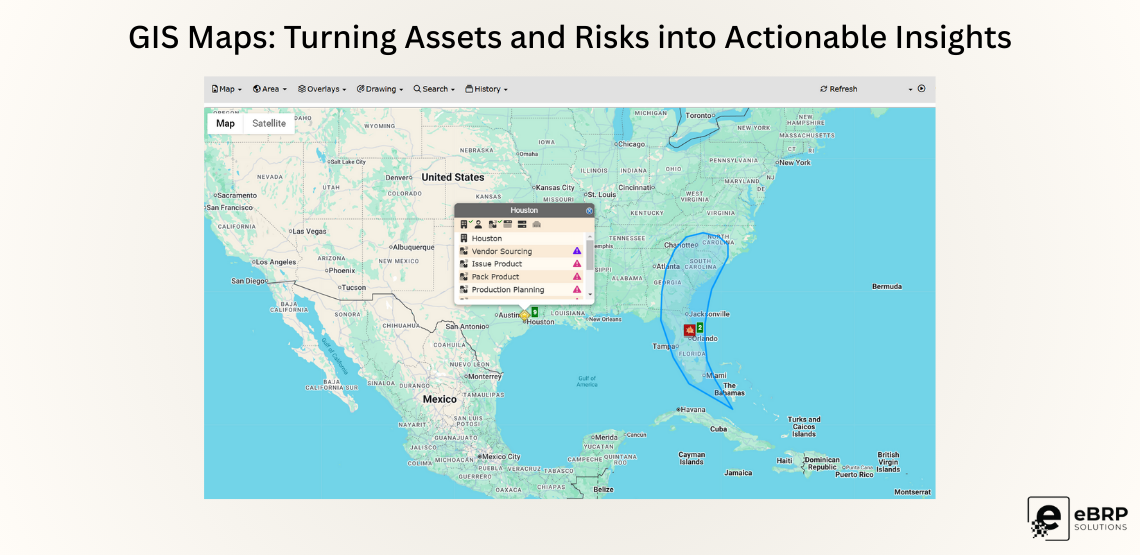
Key Capabilities:
- Map assets, recovery sites, and threat zones with standard or satellite views.
- Import KML/KMZ overlays for regions, flood plains, or utility grids.
- Run “What If?” simulations to test continuity strategies.
- Visualize evolving threats such as storms, wildfires, or civil unrest.
Value to the Enterprise:
GIS Mapping supports faster decision-making, improves collaboration between field teams and leadership, and strengthens compliance by providing clear, geo-contextual risk awareness.
Learn More: https://ebrp.net/suite/https://ebrp.net/suite/